Why Does Your Azure Autoscale Only Go Up?
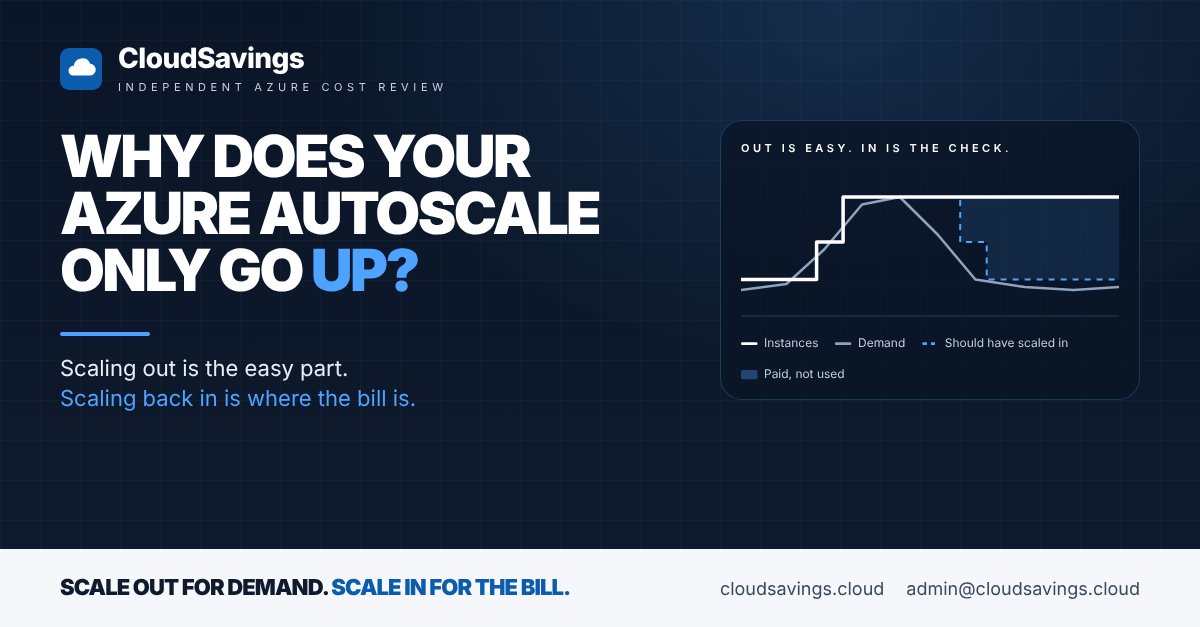
Autoscale is meant to follow demand. In many of our reviews, it follows demand up and then stays there.
The pattern is easy to miss. A busy Monday, a month-end batch or a short incident pushes a scale set, an App Service plan or an AKS node pool out to more instances. Demand drops back. The instance count doesn't. Nobody notices, because nothing is broken: the application is fast, the dashboards are green and the extra capacity just sits there, billed by the hour.
Then the invoice arrives a little higher than last month, and the month after that a little higher again. Each step is too small to trigger a budget alert. Added together, it's a platform that is sized for its busiest hour, every hour.
Why it happens
Autoscale doesn't fail loudly. When it doesn't scale in, it's usually doing exactly what its settings tell it to do.
- Scale-in is a separate rule. Microsoft's autoscale best practices are clear that with only a scale-out rule, autoscale moves in one direction until it reaches the maximum. It's common to find a scale-out rule written carefully during an incident and no matching scale-in rule.
- Scale-in is deliberately cautious. Before removing instances, autoscale estimates what the metric would look like afterwards. If that would trigger a scale-out again, it skips the scale-in or removes fewer instances. Microsoft calls this flapping protection. It's sensible, but thresholds set too close together mean it can block scale-in for good.
- Every scale-in rule must agree. Scale-out happens when any rule is met. Scale-in only happens when all scale-in rules are met. One rule on a metric that never drops low enough holds the whole set at its peak.
- Kubernetes counts requests, not real usage. The AKS cluster autoscaler decides whether a node is underused from the CPU and memory pods have requested, not what they actually use, according to the cluster autoscaler documentation. Generous requests, strict disruption budgets or pods marked not safe to evict keep nodes alive long after the load has gone.
None of these is a fault. They're settings that nobody went back to check once the busy period was over.
What to check
These are the questions we work through on every autoscaling resource in a review:
- ✔️ Scale-in rule: Does every autoscale setting have one, or does it only ever add instances?
- ✔️ Same metric: Do the scale-out and scale-in rules use the same metric? Mixing CPU out and memory in is a common cause of flapping.
- ✔️ Threshold gap: Is there a real gap between the scale-out and scale-in thresholds, so removing an instance doesn't immediately look like a reason to add one back?
- ✔️ Minimum and default: Is the minimum instance count still set to whatever was needed during the last incident? If current capacity is above the default count, autoscale won't scale in while the metric can't be read.
- ✔️ All rules met: With more than one scale-in rule, can every one of them actually be true at the same time on a quiet day?
- ✔️ AKS requests: Do pod requests reflect real usage, and are disruption budgets, local storage or
safe-to-evict: "false"annotations keeping nodes from being removed? - ✔️ Cosmos DB ceiling: Is the autoscale maximum far above your real peak? Cosmos DB autoscale never goes below 10% of the maximum, and each hour is billed at the highest throughput reached in that hour.
How to check your own estate
All of these steps are read-only.
- In the Azure portal, open Monitor, then Autoscale. This lists every autoscale setting you can see, with its resource and whether it's enabled. Note any resource where the current instance count sits at or near its maximum.
- Open a setting and select the Run history tab. Compare scale-out and scale-in events over the last few weeks. Plenty of scale-outs and almost no scale-ins is the pattern to look for.
- Select the JSON tab. For each profile, confirm there's a rule with
"direction": "Decrease", that it uses the same metric as the scale-out rule, and that the minimum and default counts still make sense. - In Logs for your Log Analytics workspace, search the activity log for autoscale flapping events, for example
AzureActivity | where CategoryValue == "Autoscale", and look for operations ending inFlapping/Action. Repeated entries mean scale-in is being skipped or reduced. - For each AKS cluster, run
kubectl get configmap -n kube-system cluster-autoscaler-status -o yamlto see what the autoscaler thinks about each node pool. If thecluster-autoscalerdiagnostic log is enabled, it records why nodes couldn't be removed. - For Cosmos DB containers on autoscale, open Metrics and chart Normalized RU Consumption against the configured maximum over a month. A peak that never comes close to the maximum means the 10% floor is higher than it needs to be.
- Finally, in Cost Management, open Cost analysis, group by resource and filter to the services above. A cost line that steps up after a busy period and never steps back down tells you which setting to look at first.
Treat scale-in as part of the design, not an afterthought. This sits squarely in the FinOps Framework's Usage Optimization capability: resources that only run when needed, at the size the work actually requires.
Sources
- Best practices for autoscale, Microsoft Learn
- Autoscale flapping, Microsoft Learn
- Get started with autoscale in Azure, Microsoft Learn
- Cluster autoscaler in AKS, Microsoft Learn
- Autoscale provisioned throughput in Azure Cosmos DB, Microsoft Learn
- FinOps Framework: Usage Optimization, FinOps Foundation
An independent view of your Azure spend. I sell no licences, managed services or remediation, so my findings have nothing attached to them.
Book a 30-minute call